
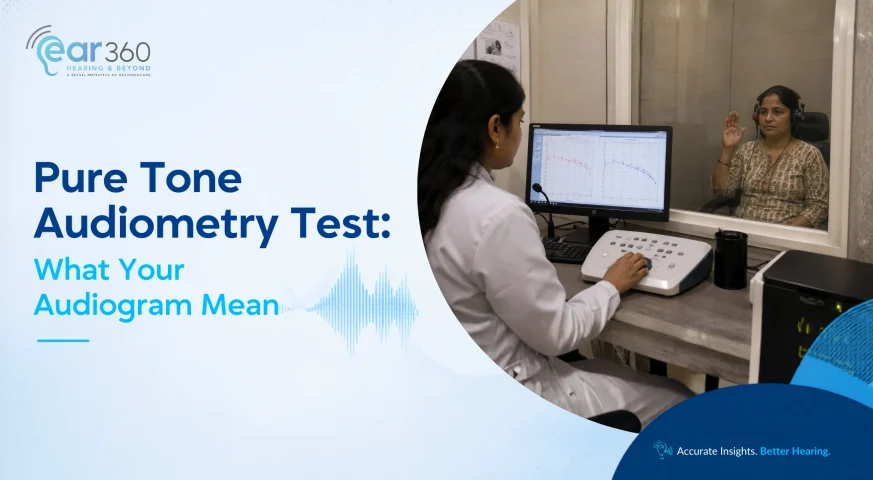
Pure Tone Audiometry Test: What Your Audiogram Means
TL: DR; This blog is primarily written for patients, caregivers, and families who are trying to understand hearing difficulties, pure tone audiometry test results, and what an audiogram means before seeking audiology care. Pure-tone audiometry tests hearing: by measuring how well you hear different pitches and volumes. Your audiogram shows results: It maps your hearing levels across low to high frequencies. Hearing thresholds matter: They show whether your hearing is normal, minimal, mild, moderate, severe, or profoundly reduced. It identifies hearing loss type: Results can suggest conductive, sensorineural, or mixed hearing loss. It guides treatment decisions: Your audiogram helps decide if you need medical care, hearing aids, or further evaluation. Get checked at Ear360 clinics: Visit Ear360 clinics if you notice tinnitus, muffled hearing, loud TV volume, or trouble hearing conversations. It is not always obvious that someone is losing their hearing. These can sometimes start with little things, such as making people repeat themselves, turning up the television volume, difficulty understanding what people say in noisy environments, or feeling really tired after listening all day. The changes can be baffling, particularly if you’re not sure whether they’re temporary, due to age, noise, or something that should be treated. This is where a pure tone audiometry test can come in handy. Helps to give a clear idea of how well you hear the various sounds and pitches, and the results are displayed on a chart called an audiogram. We believe that when patients are informed, they make better choices about their health, and that is why we are ResonnoCare. This article covers what happens during a pure-tone audiology test, what the results might mean, and what to do next. What Is Pure Tone Audiometry? Pure tone audiometry quantifies auditory sensitivity to sound frequency in hearing assessments. For audiologists, this helps assess the presence, configuration, and severity of hearing loss. This also pinpoints frequency impact. You are made to listen to tones of different frequencies and volumes through a bone vibrator. Tones are presented one at a time. You respond to each tone by pressing a button, and this is done for each tone at each frequency. Hearing threshold is defined as the softest tone that is detected 50% of the time. The pure tone audiometry test is noninvasive and painless. The test takes 20 to 30 minutes. The assessment is conducted for individuals as young as 5 and serves as the basis for many other auditory assessments. What Does an Audiogram Show? A pure-tone audiometry test produces a graph called an audiogram. At first, this chart may seem daunting, but it will be very easy to understand once you learn what you’re reading. Frequency or pitch is plotted on the horizontal axis, in units of Hertz (Hz). The range of frequencies is from 250Hz (low-pitched sounds, such as a rumble) to 8000Hz (high-pitched sounds, such as a whistle or a bird call). This frequency range is of great importance clinically because human speech is in the range of 500Hz-4000Hz. Loudness is shown on the vertical axis in dB Hearing Level (dB HL). Typically, it will range from 10 dB (very soft) at the top to 120 dB (extremely loud) at the bottom. The lower the mark on the audiogram, the louder a sound must be for you to hear it, and the greater the hearing loss. The thresholds on the audiogram are indicated by symbols for each ear: O (red) = right ear thresholds X (blue) = left ear thresholds [ and ] = bone conduction thresholds (help determine type of hearing loss). The thresholds for all frequencies tested on a normal audiogram are between 0 and 25 dB. Numbers higher than this indicate hearing loss of varying degrees. How to Read the Main Symbols on Your Audiogram The symbols on an audiogram help the audiologist separate the right ear from the left ear and compare different ways of presenting sound. Do not interpret one symbol in isolation; look at the complete pattern across frequencies. Symbol or report feature What it generally represents Why it matters O Right-ear air-conduction threshold Shows the softest tones detected through the usual outer-, middle-, and inner-ear pathway in the right ear. X Left-ear air-conduction threshold Shows the corresponding hearing thresholds for the left ear. Bone-conduction symbols Thresholds measured while bypassing much of the outer and middle ear Help the audiologist determine whether a conductive component may be present. Connected threshold points The hearing pattern across frequencies Shows whether hearing is relatively flat, slopes toward poorer high-frequency hearing, or has another configuration. Different audiogram software or masking conditions may use additional symbols. If your report includes symbols you do not recognize, ask the audiologist to identify them rather than trying to diagnose the result from an online symbol chart alone. Right Ear vs Left Ear: Why the Difference Matters An audiogram displays each ear separately because hearing loss does not always affect both ears in the same way. One ear may have normal or near-normal thresholds while the other has reduced hearing, or both ears may have hearing loss of different degrees or patterns. When reviewing your audiogram, ask: Are the right and left ears similar? Is one ear noticeably poorer than the other? Does one ear understand speech less clearly? Is the hearing loss present at the same frequencies in both ears? Is the difference between ears expected from my medical history? Does the asymmetry require additional medical or ENT assessment? A significant or unexplained difference between ears should be interpreted by the audiologist together with your symptoms, speech-test findings, tinnitus, dizziness, ear history, and other clinical information. What Do Frequency and Decibel Numbers Mean in Real Life? The horizontal and vertical numbers answer two different questions. Frequency tells you which pitch is being tested, while dB HL tells you how loud that tone needed to be before you detected it. Audiogram feature Simple meaning Possible real-life relevance Lower frequencies Lower-pitched sounds May contribute to the fullness and strength of speech and environmental
Read More